Buyers are bouncing back

We are still seeing plenty of buyers being very active especially since we started being allowed to do open homes again in May, and we have the national data to prove it!
The latest CoreLogic data show Home sales have risen, with home owners testing the market, and more properties coming onto the market. In fact, buyer demand is outweighing the new listings coming onto the market.
May shows a strong absorption of new listings
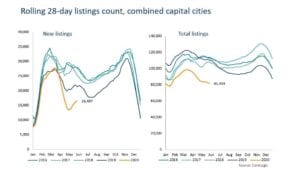
CoreLogic counts an advertised property as a ‘new’ listing if it has not listed on the market in the past 72 days. Total listings are the sum of all properties, ie both new properties and properties that have been on the market before. The count of new and total listings are typically reported in rolling 28-day periods.
In the 28 days to 31st of May, new listings rose 22.4% on the previous period, but total listings fell 2.9%. While on the face of it the fall in the total figures doesn’t look great, what it actually means is, as more new properties came onto the market, buyer activity offset the additional properties coming onto the market.
CoreLogic’s listings charts below, show the new listings count over a rolling 28 day period creeping higher, as total listings levels trend slightly lower.
Why is this trend so important?
At the moment, we’re facing record high levels of housing debt, job and income losses, all of which could lead see more homeowners being forced to sell.
The latest Government figures show that for each percentage point rise in unemployment, there has typically been an 80 basis point rise in the rate of mortgage arrears.
The problem is, if a large volume of properties are listed simultaneously due to home owners being forced to sell, it could see property values fall; while it makes it harder for homeowners to make any capital gains, it also makes it harder for banks and lenders to potentially recoup the full cost of the loan.
This is why banks have offered ‘repayment holidays’ on mortgage repayments. APRA data suggests 60% of bank loans and advances are in housing, so a fall property values ultimately affects bank profits and capital.
Another way to assess the uptake of new listings is to look at the ratio of sales to new listings. This is found by dividing sales volumes by the number of new listings, and has been used as a leading indicator of property price movements.
The sales to new listings ratio for the combined capital cities on a monthly basis is plotted in the chart below.
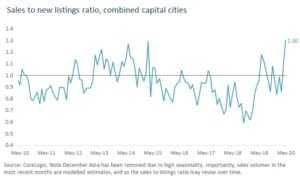
The ratio of new properties listed to properties sold increased from 1.1 in April to 1.3 over May, coinciding with an estimated increase in sales volumes of 20.4% across the combined capital cities over the month. This is the highest sales to new listing ratio in at least 10 years, though sales and listings volumes are still at very low levels.
Why is demand so high?
With the economy severely impacted by COVID-19, it is surprising to see such a strong rebound in transaction activity. But let’s look at a few factors:
- Low sales in April
Over April, the number of sales across the combined capital cities market was estimated to be just 16,115. That is the lowest monthly sales volume since 1991 (excluding January results).
It is also pales in comparison to the decade average of 24,700 sales per month across these markets. Although a 20.4% uplift is significant, it still only brings sales volumes to an estimated 19,400 over May.
- Rise in consumer confidence.
The ANZ Roy Morgan weekly consumer confidence index has risen consecutively for the past 9 weeks. At the week ending 31st of May, the index is 50.5% higher than when it bottomed out in late March. In fact, the index is now just 9% lower than when Australia confirmed its first case of coronavirus in January.
The easing of social distancing policies and low COVID-19 case numbers in Australia mean people may be feeling more confident about the future of the Australian economy, their personal finances, and property purchases.
- Who COVID-19 has impacted
Realistically, the workforce demographic most impacted by COVID-19 are probably are less likely to have a mortgage. From 14 March to 2 May, 27.1% of payroll jobs have been lost across accommodation and food services, and 19.0% of jobs have been lost across arts and recreation.
This is backed up by Data from the ABS and HILDA, which suggests the share of households renting that are in food and accommodation services, and are hence in a more precarious financial situation, is around 40%.
This suggests that for now, conditions have been relatively stable in the housing market because those most impacted by the economic slowdown of COVID-19 may be less likely to have a mortgage obligation.
What it means for sellers
A lot of vendors traditionally hold off until Spring, which as a result, does flood the market. From what we’re experiencing and these the figures are saying, now is a good time to sell and while we don’t have a crystal ball, potentially, this year could actually turn out to be even bigger than normal.
If you are looking to sell and would like to know what you can do to enhance your property, get in touch. We provide a free, independent and non-obligatory quotes and our experienced team can give you tips and advice on what you can do to improve your property’s value. Having been in the business for 40 plus years, we’ve helped thousands of people and are constantly achieving great results.
Call in and see us in the Cardiff office or give us a call on 02 4954 8833. Or send us an email to: mail@apnewcastle.com.au – we’d love to hear from you.
And don’t forget to check out our Facebook page for handy tips on selling your property or what to look for when buying a property.